Risk Mitigation Report
Overview
The Risk Mitigation Report is essential for identifying and managing potential risks. It helps track vulnerabilities, monitor high-risk areas, and analyze trends to prevent issues before they escalate. This report provides valuable insights to strengthen security measures, ensure compliance, and enhance overall risk management strategies.
To configure a Risk mitigation Report, follow these steps:
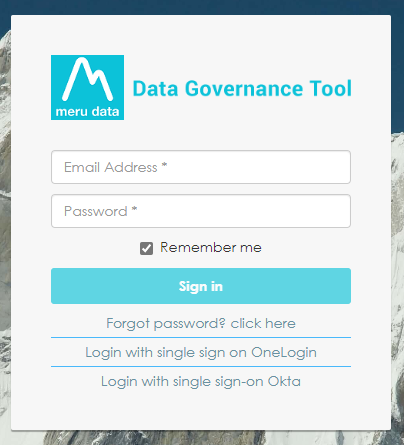
Sign into your Data Governance Tool account.
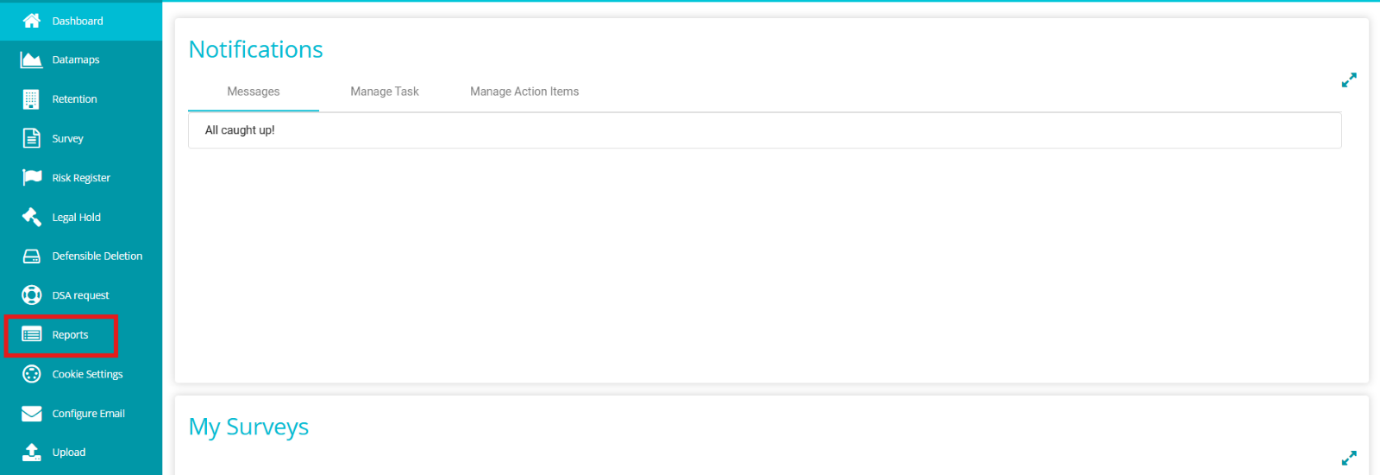
Click on the hamburger
 icon to open the menu.
Select 'Reports' from the menu.
Click on the
 button on the screen.
From the Manage Reports page, click on Custom-Defined .
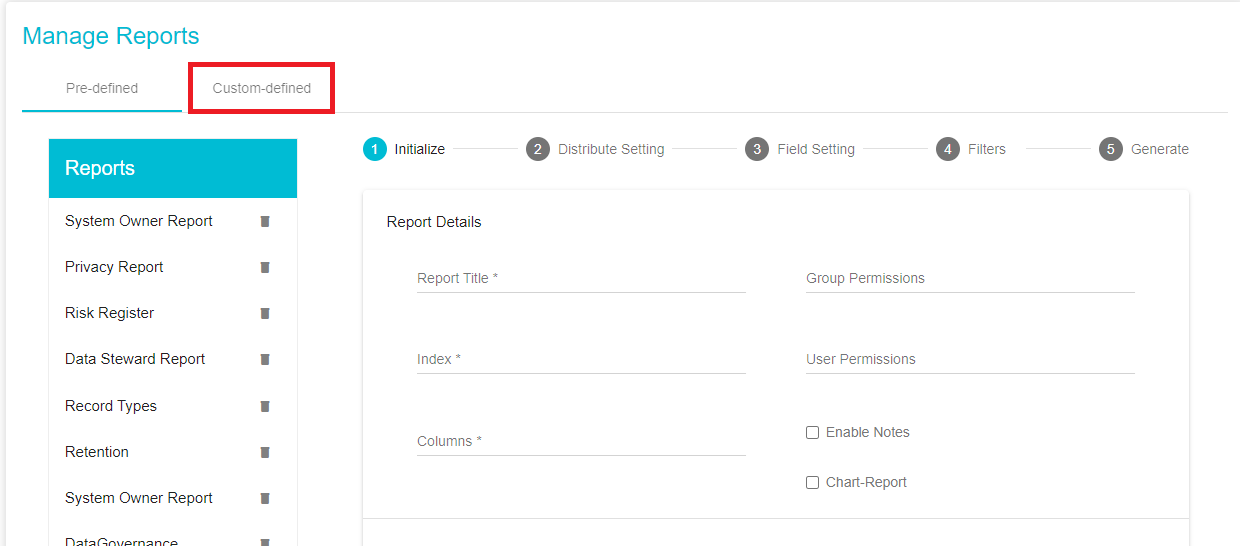
Once on the Custom-Defined tab, under the Initialize section add the report details. The first section of the Custom Defined Tab is the Initialize Section.
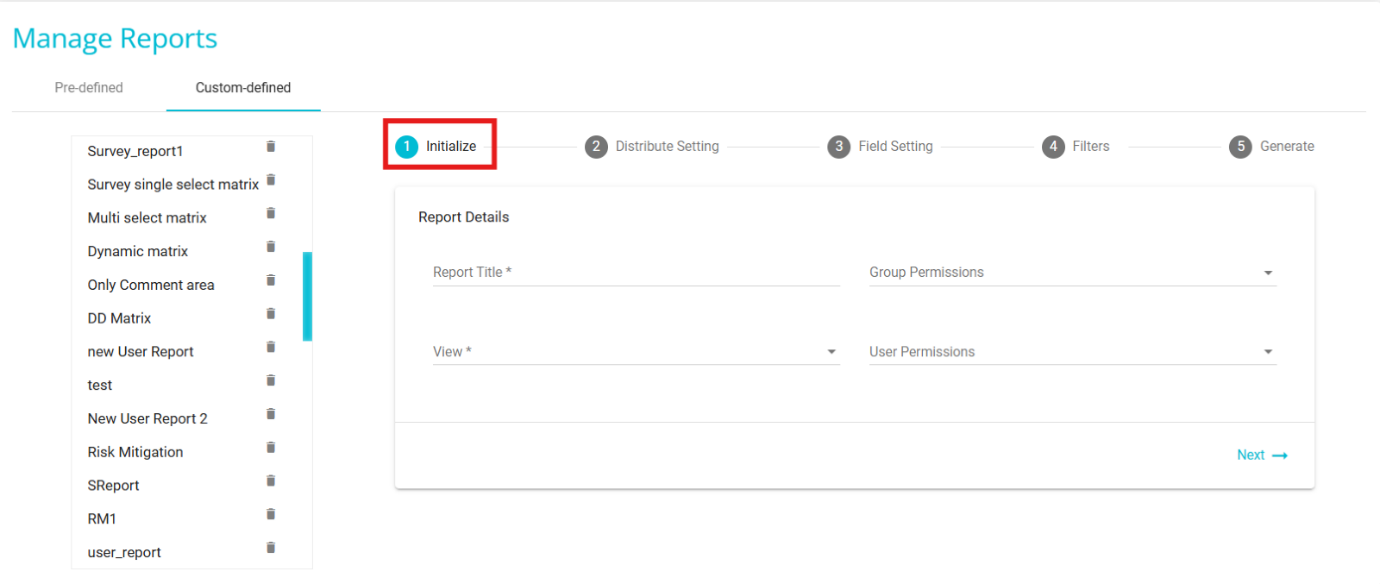
Report Title: add a custom Title to the report.
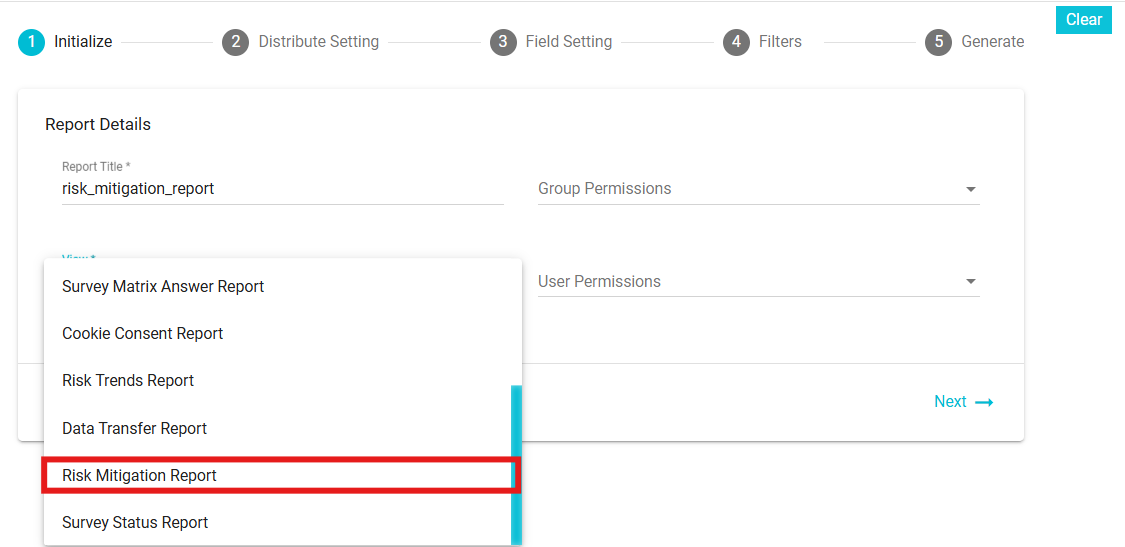
View: Select "Risk Mitigation Report " from the drop-down menu
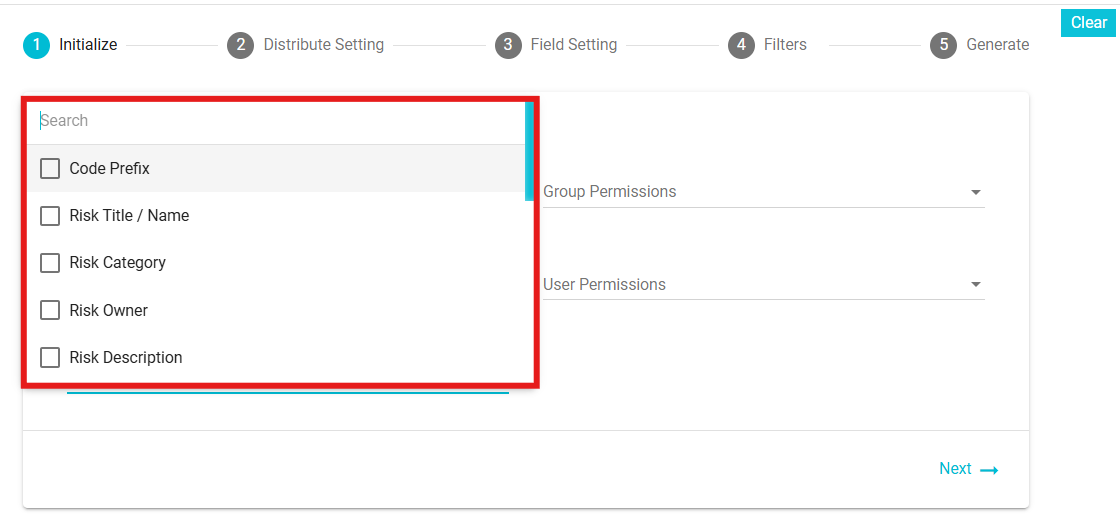
Columns: Once Risk Mitigation Report has been selected, from the Columns drop-down menu select the columns/fields to be included in the Report. The list of columns to be included are the details of the requests, such as the Risk Owner, Code Prefix and so forth.
Group Permissions: From the drop-down menu, select the groups to which this Report should be made available. The report will be visible in the Reports module for the selected user groups.
User Permissions: If the admin prefers not to expose the report to the entire group, it can be published at the user level. From the drop-down menu, select the users to which this Report should be made available. The report will be visible in the Reports module for the selected users.
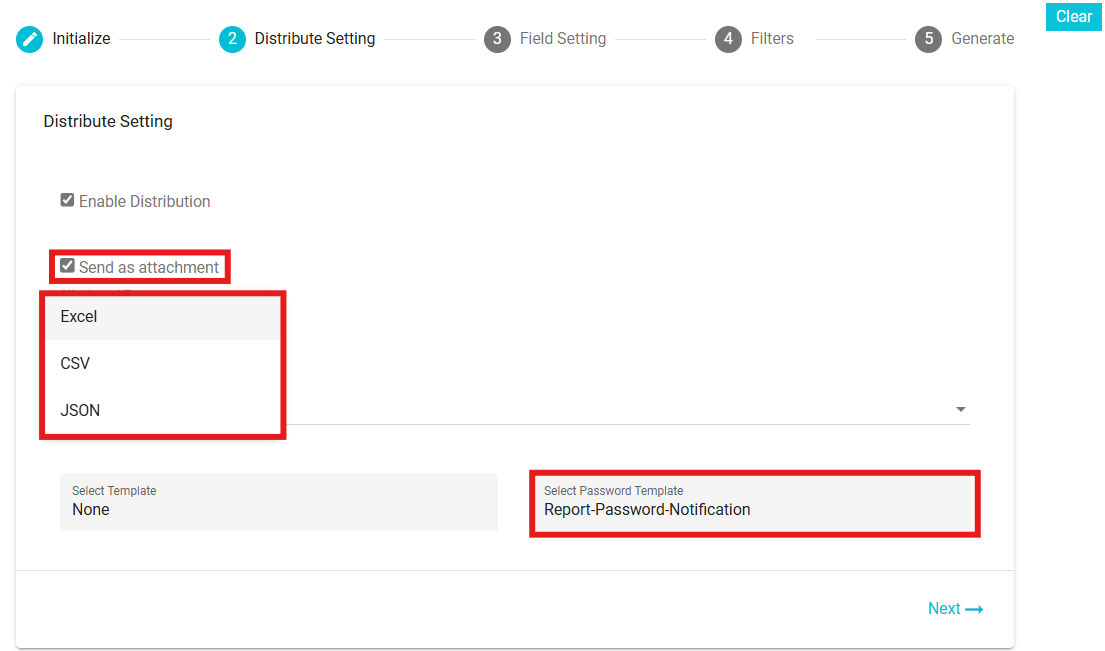
Next move to the Distribute Settings section
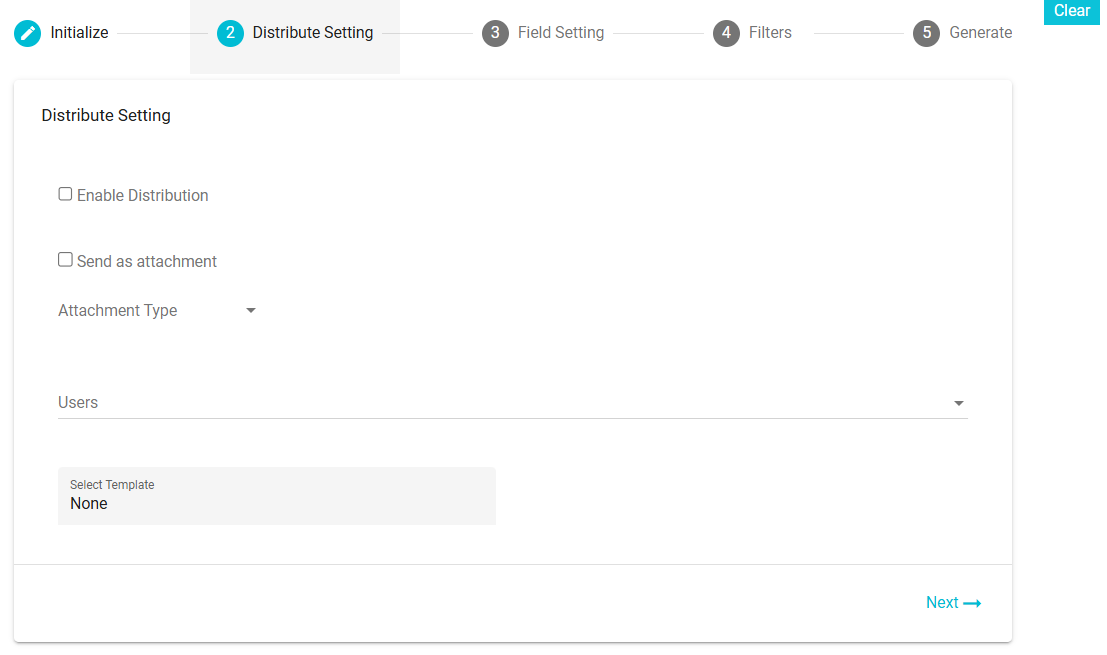
Enable Distribution: Check this box to automate the distribution. The report will be sent automatically to the selected users. The frequency will be determined based on the configured email template(i.e. daily, weekly, monthly or yearly).
Users: Select the users to whom the report should be sent. Users can be either single or multiple.
Send as an Attachment: Enable this checkbox if you want to send the report as an attachment in the email.
Attachment Types: Select the format of the attachment from the available options: Excel, CSV, or JSON.
Select Password Template: Choose the email template for sharing the password required to access the report attachment.
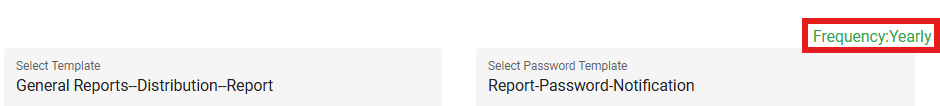
Select Template: Select the email template here. The templates here are defined in the Configure Email module. While configuring the email, the frequency with which it should be sent is also selected and the same is applied here, depending on the template selected. Different templates have different frequencies. To configure an email template for a report, you need to define templates based on specific event types. These event types determine the templates available, which are then displayed on the Distribution screen for selection.
For Example: General Reports - Distribution - Report: Used to configure and distribute general reports to selected users or groups .Report - Password - Notification: Sends notifications related to report passwords, ensuring secure access to the distributed reports. If the frequency has not been configured, the frequency field here will not be visible.
8. Next move to the Field Setting Section
Column Sorting -- with this feature you can arrange the columns one at a time, depending on their values; alphabetically or numerically.
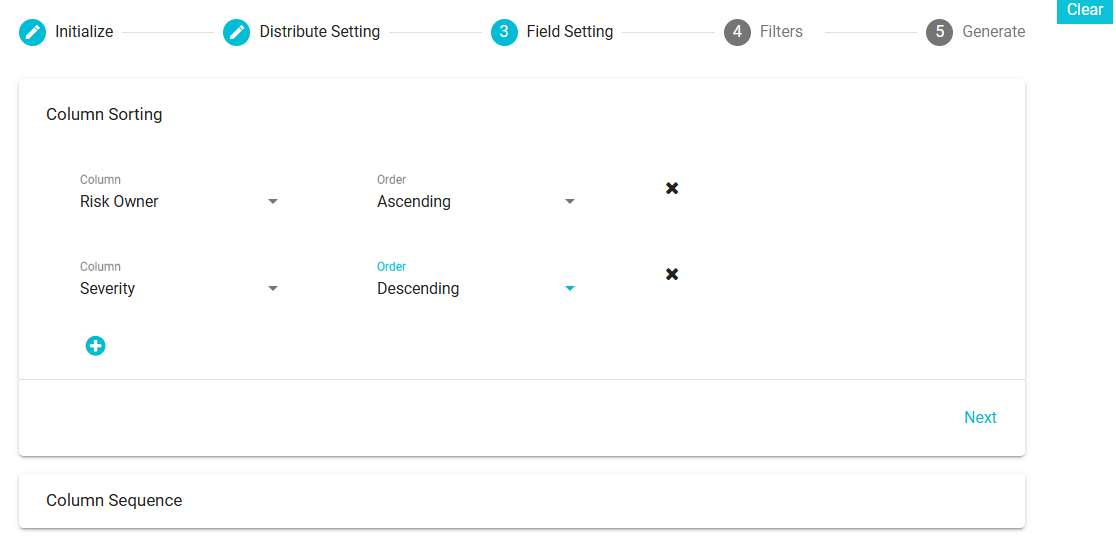
Column: From the selected columns, pick the column that you want arranged in an ascending/descending order.
Order: Select the order here; ascending or descending
Add button
 : Configure the order of as many
columns as required by clicking the Add button.
: Configure the order of as many
columns as required by clicking the Add button. Remove button
 : Remove the configuration of any column as required.
Column Sequence - under the Visible Columns section, drag and drop the columns to set the order of their display. Drag and drop any column to the Hidden Columns section to remove that particular column from your report.
: Remove the configuration of any column as required.
Column Sequence - under the Visible Columns section, drag and drop the columns to set the order of their display. Drag and drop any column to the Hidden Columns section to remove that particular column from your report. 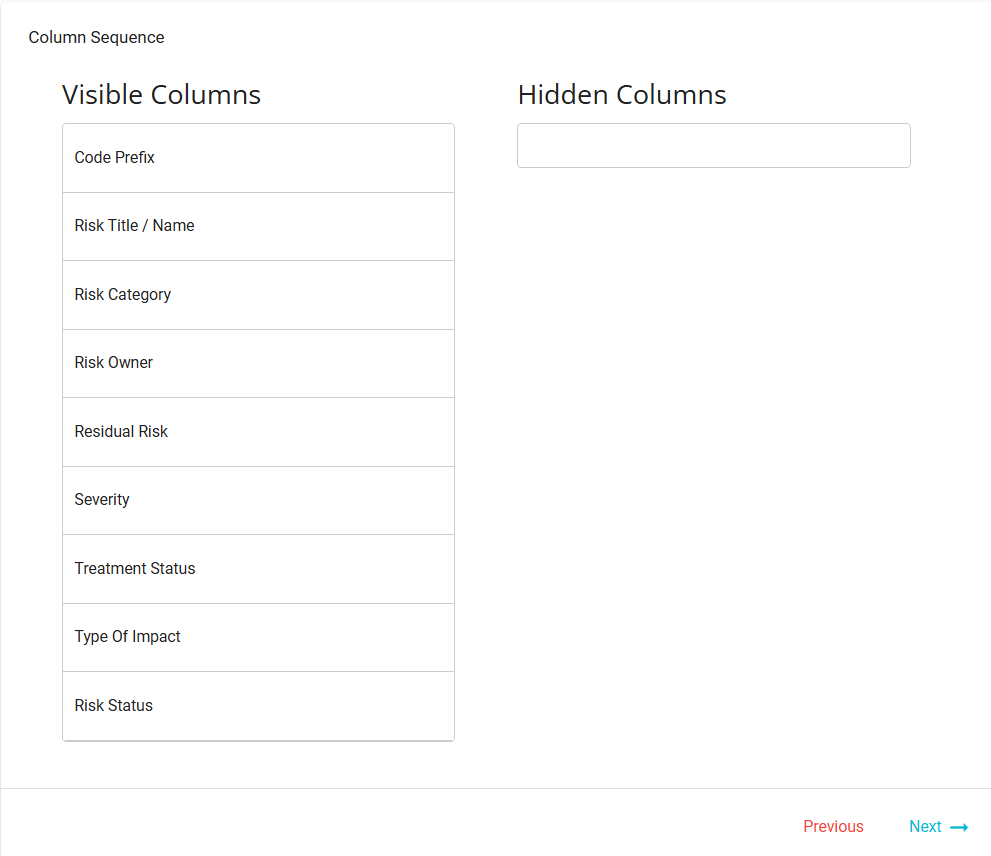
Next move to the Filters Section
Here you can configure the contents of your report. You can Add Rule, Add Ruleset or Delete Ruleset. However, you cannot apply "Equals" operation for Date column or Boolean.

Finally move to the Generate Section
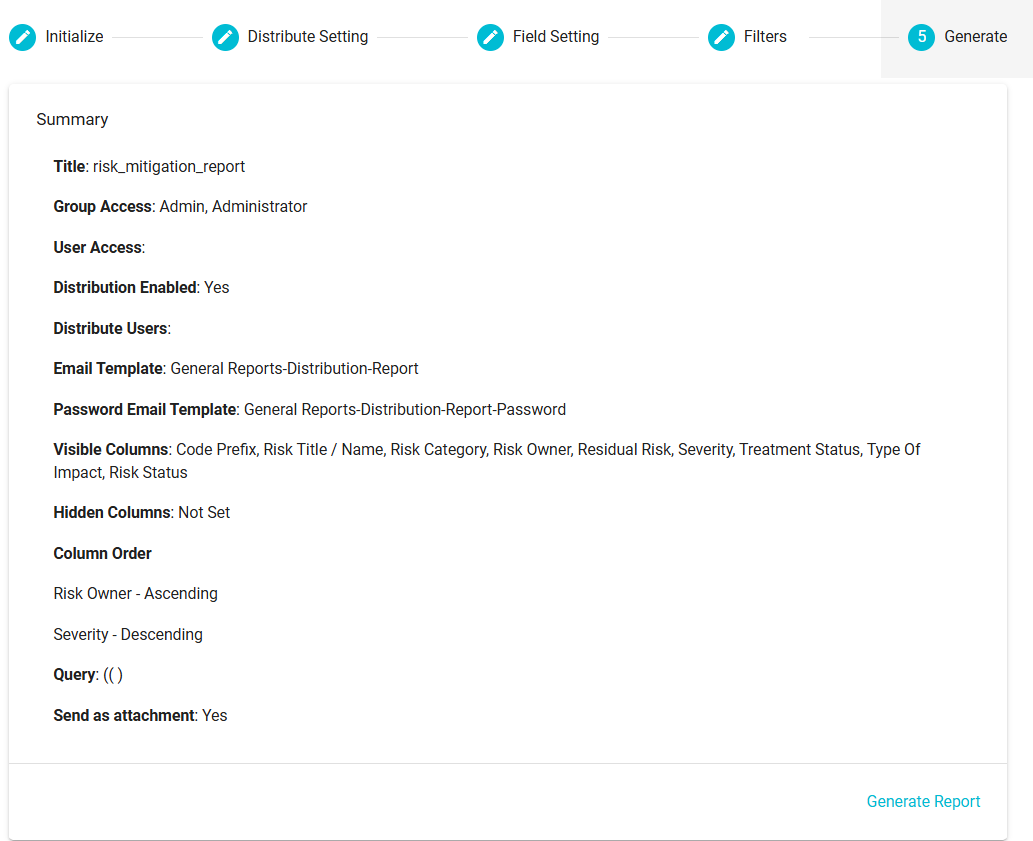
On this section, you can see the summary of the configuration for the report that are about to generate. Changes can be made by going back to the sections of your choice and making the required changes. Finally, on clicking Generate Report, the configuration will be saved, the report will be available in the Reports Module for those users and groups with the permission, and the users selected will receive a copy of the report on their email.
If you decide to discard the configuration for the report, you can click the
 button.
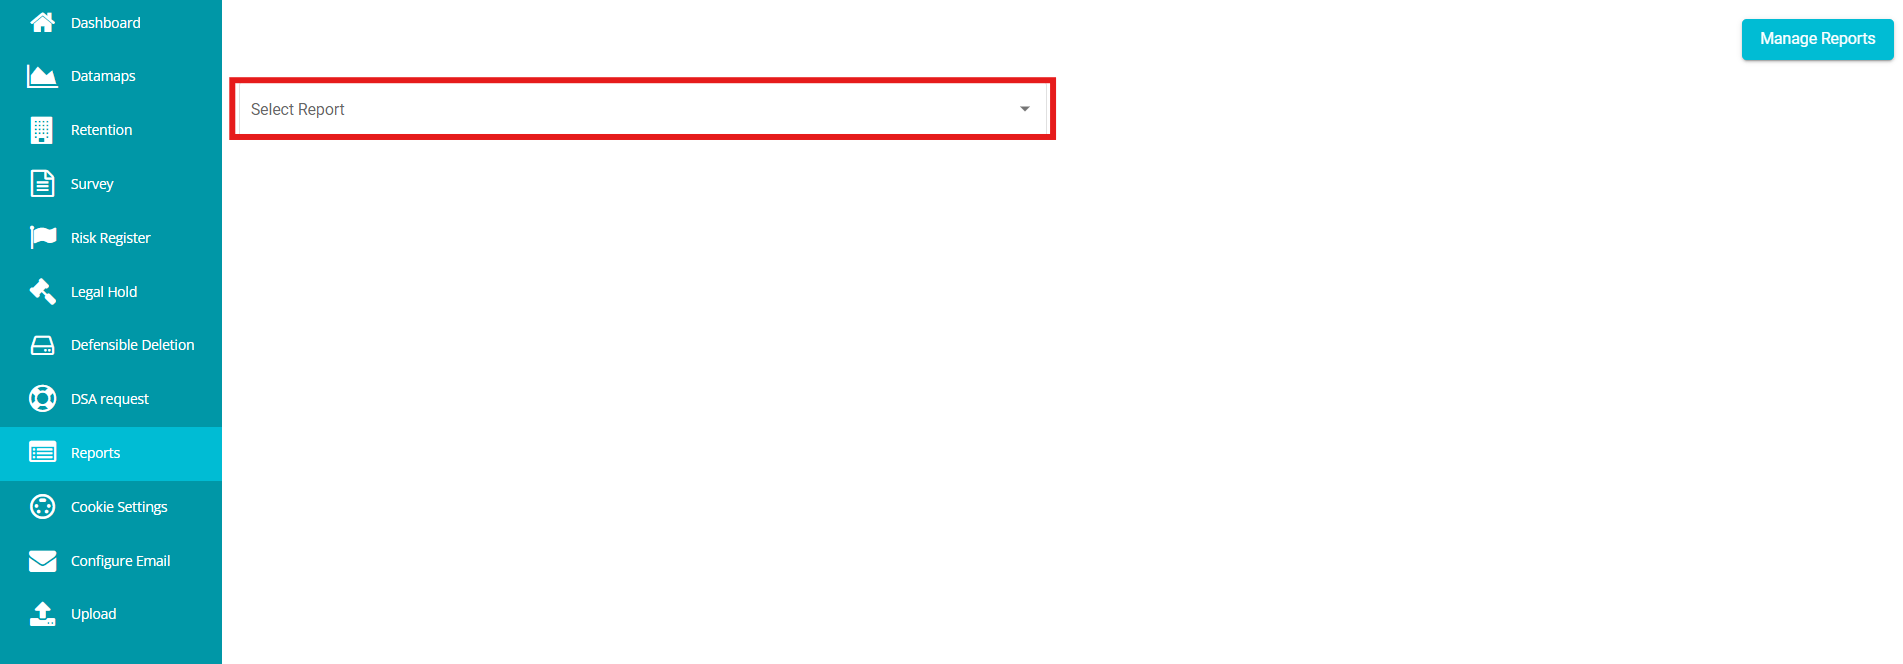
To view the risk mitigation report, follow these steps:
Click on the "Select a Report" drop-down on the Reports page to choose and view a specific report.
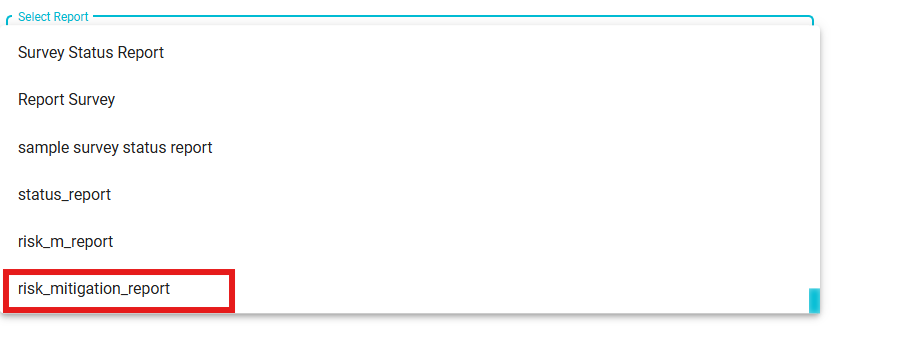
From the dropdown, select the report you want to view.
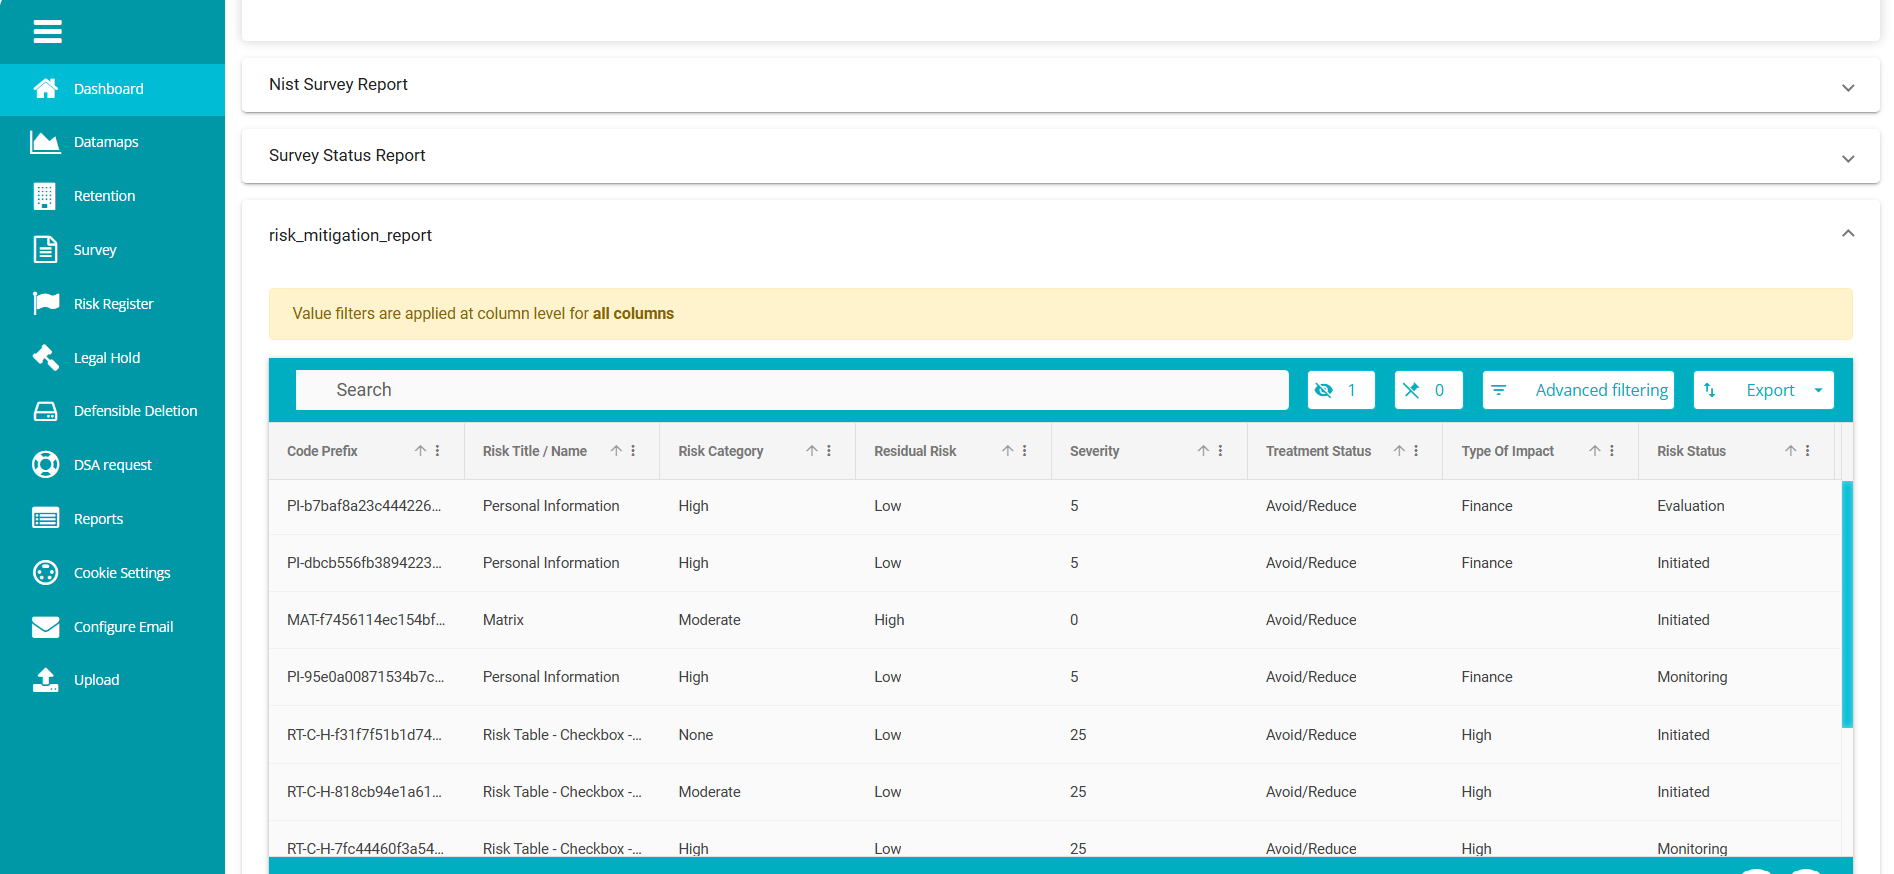
On clicking, the report will be displayed in the following format.
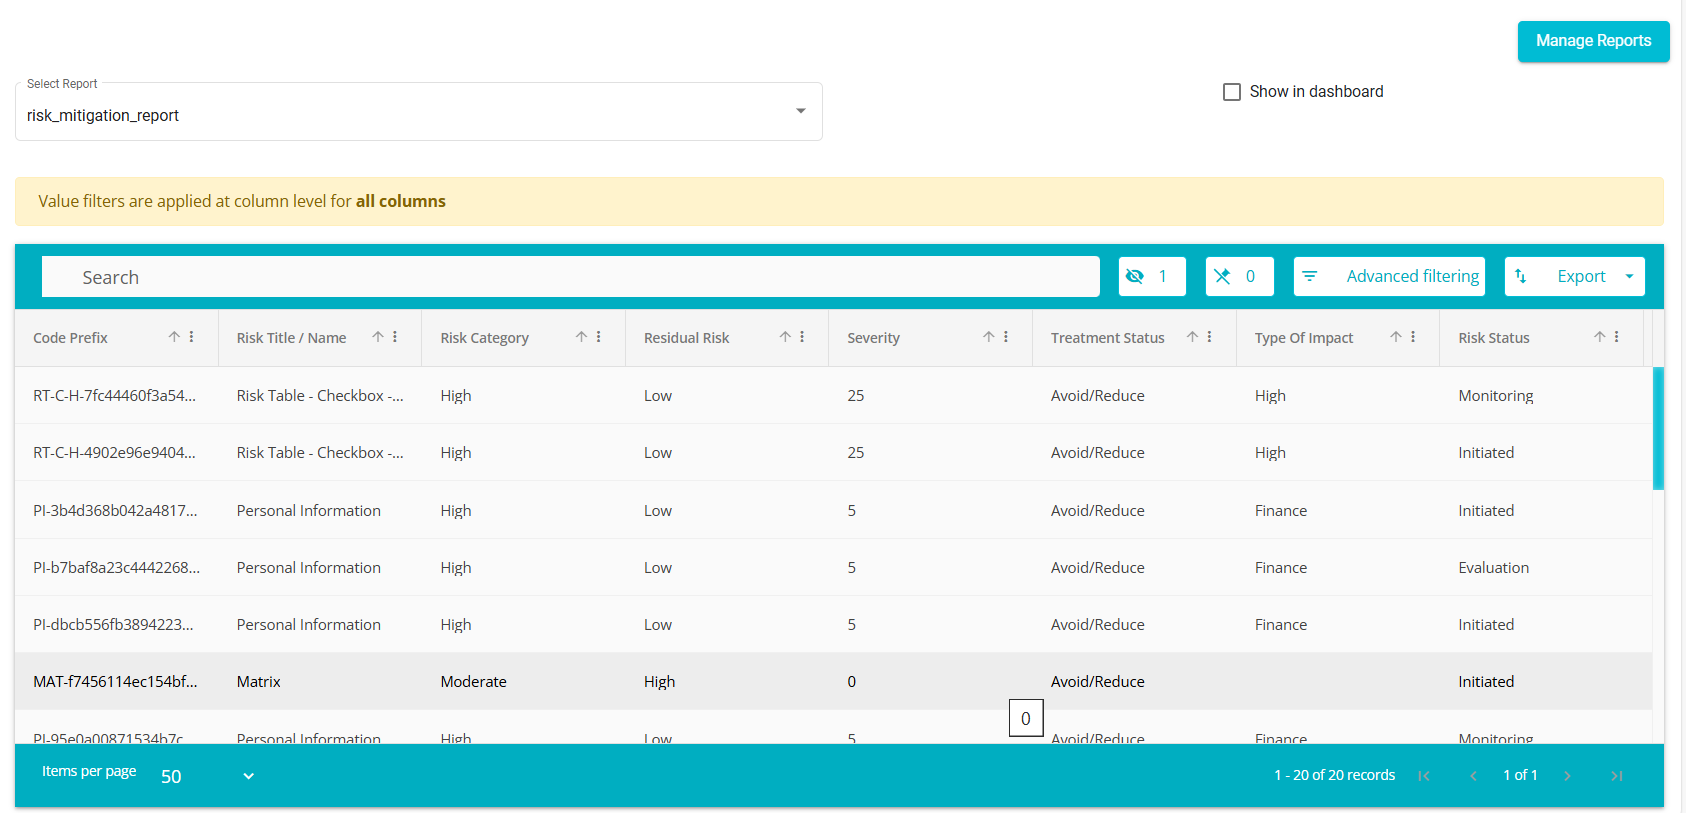
Check the "Show in Dashboard" box to display the report on the main dashboard.
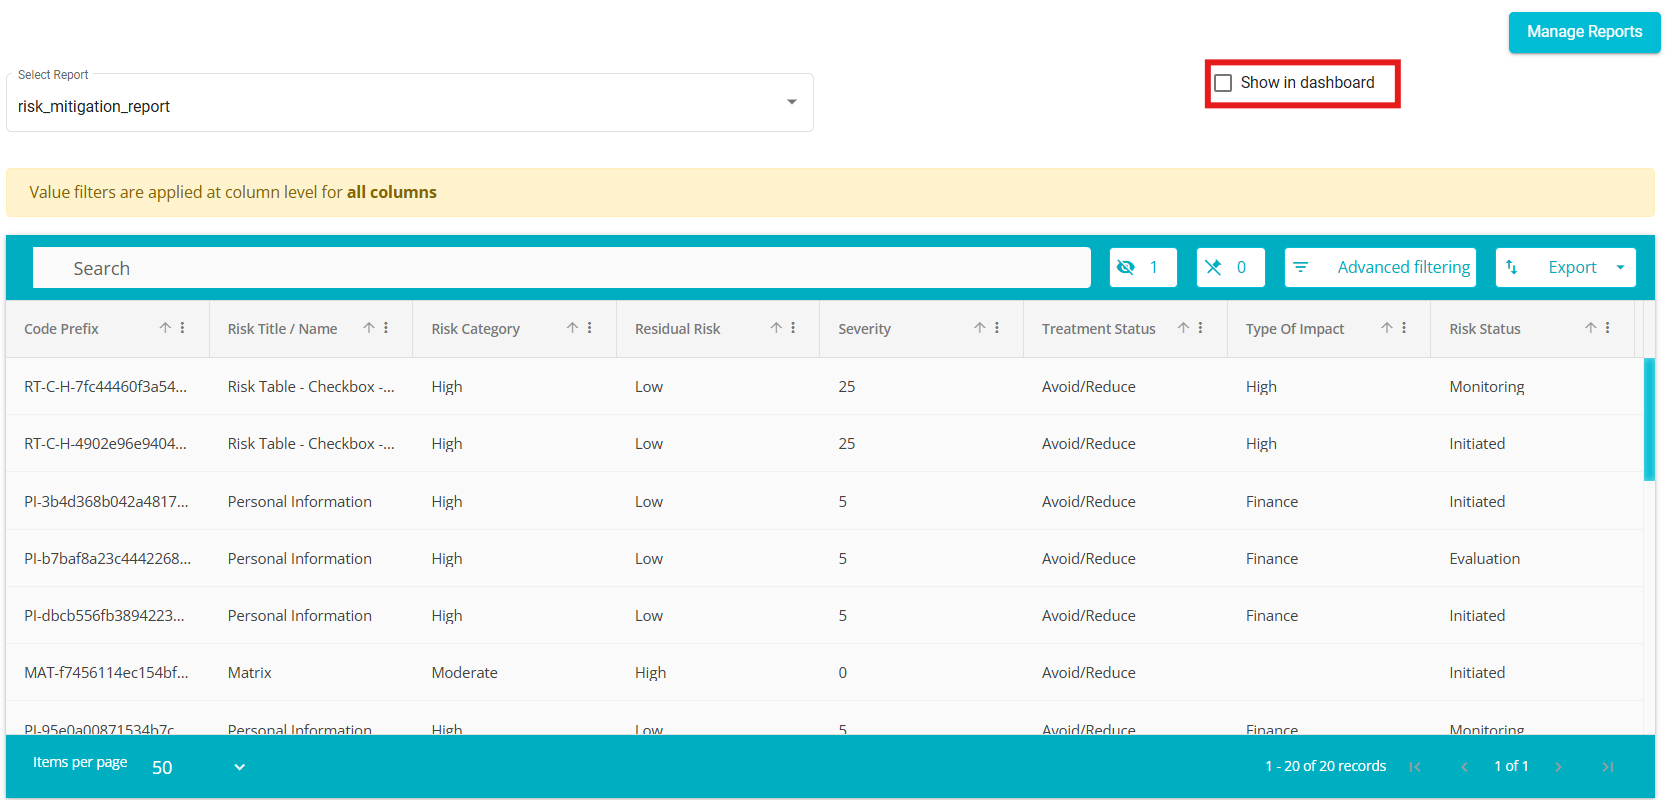
The report appears on the main dashboard.
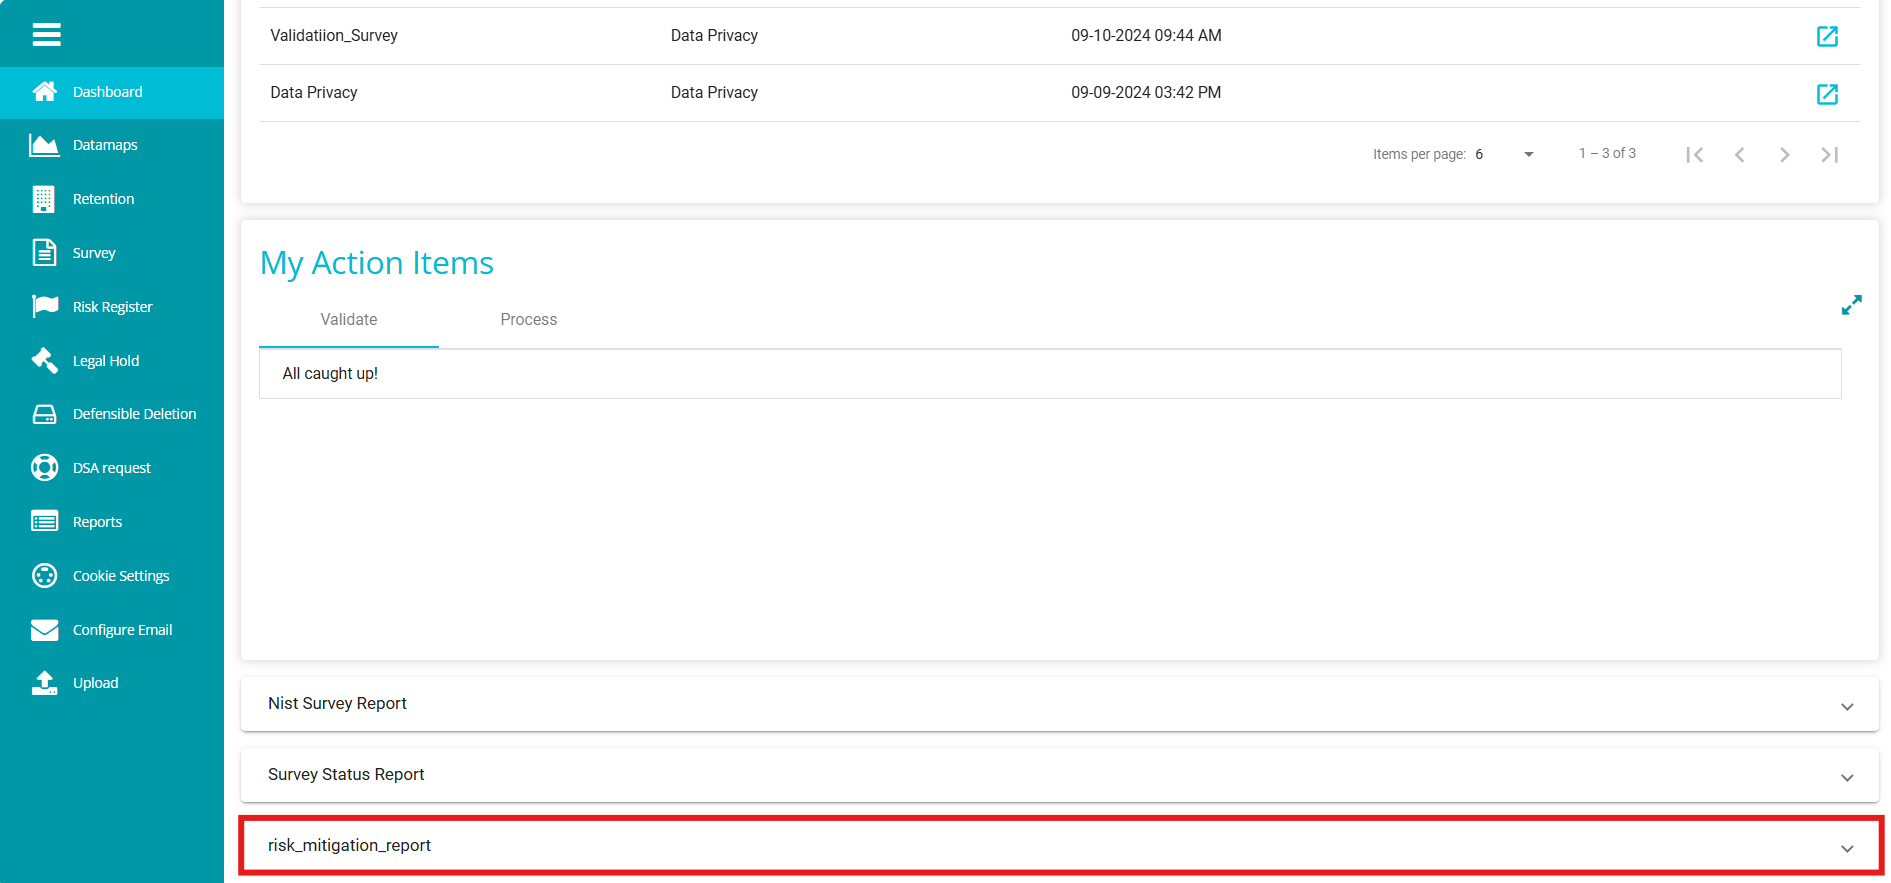
Click on the report to view it directly on the dashboard instead of navigating to the Reports module.